
By Joeri De Turck, CTO, OTA Insight - 9.7.2019
With the evolving distribution landscape changing the relationship between OTAs and hotels, the data used by revenue managers to make informed decisions is more important than ever. Rate shopping tools provide hoteliers with knowledge on their overall market and competitor pricing, insights they rely on daily. With prices changing so frequently, the data that powers rate intelligence tools must be accurate and up-to-date.
Two particular areas can cause data accuracy problems for revenue managers when attempting to compare rates meaningfully: tax is one; the other is currency conversions.
At OTA Insight, we normalize tax across all levels: hotel, OTA, city and country. We also take account of different percentages and amounts, such as VAT at 20%, for example, or a $1 per night city tax. We map this data to every hotel and OTA we track, updating it daily.
For accurate comparisons, we always normalise the taxes between any two channels in question so that we’re comparing apples to apples.Updates that rely on manual intervention are error-prone; by automating the process we minimise inaccuracy in our rates.
For currency conversions, we take a daily snapshot of all exchange rates. We always look at conversions for the day in question, so for rates extracted at 3pm on 1st June 2019, we’ll use whatever the exchange rate was at that precise date.
For parity between two channels in different jurisdictions, our algorithm is designed to detect and ignore small discrepancies that are related purely to currency, eliminating false positives.
Breadth of sources
To capture as full and varied a picture as possible, we gather rates:
- For hotels around the world: our coverage is truly global;
- From multiple points-of-sale: the growing list of POS source markets from which we draw rates data includes traveller-heavy countries in Asia, Europe, America and the Middle East, meaning we detect differences in geo-targeted prices; and
- From desktop and mobile: this ensures that we detect differences emanating from the likes of mobile promotions.
Variety of data
Data variety is all-important when it comes to comparing apples to apples. This is why we offer:
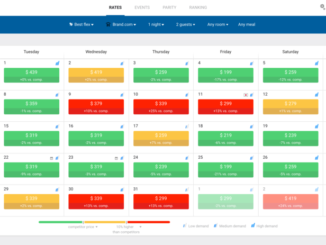
- Rate types: for a meaningful comparison, you need to know whether a given room displays the best flexible rate or the lowest rate (with reduced flexibility);
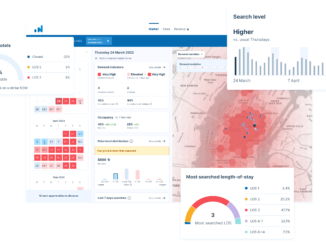
- Length of stay information: from one night up to 30, the rate per room per day reveals how pricing evolves for longer stays. Different hotels’ LOS discounting strategies can vary widely, as demonstrated in this exclusive report, so access to this information when comparing your prices to your compset’s is valuable;
- Room types: premium, standard, suite, etc: a room’s type is one of the most significant factors to affect its rate; and
- Brand.com rate types: rate types for hotels’ own websites, which show how different hotels tier their rates – whether public, member-only, AAA, senior, AARP, government, military, etc. – can help you refine your strategy when competing for direct business.
Hotel rate data
- Lowest rate as compared to best flexible rate;
- Member only as compared to non-member, drawn from your site and your competitors’ Brand.com sites;
- Whether it’s room-only rates or bed and breakfast is included;
- Rates for earlier days, specifically yesterday, three and seven days ago, and the same day of the week that time last year; and
- Length of stay discount variations.
Silo breakdown
- PMSs: we unlock the potential of your PMS by drawing its data into Revenue Insight, delivering lightning-fast, actionable insights so you can confidently make better revenue decisions.
- Some Rate Insight data is also drawn into Revenue Insight;
- RMSs: Rate Insight data can be fed into these to help with the automation of pricing decisions, with benefits including:
- Multiple updates of fresh rates every day; Live refreshing whenever a user chooses to activate it;
- Rates available up to 365 days in advance; and
- Brand.com, OTA and GDS all as data sources;
- OTA Insight’s own tools: Revenue Insight works with Rate Insight; Rate Insight works with Parity Insight; and
- Various other data sources.
Data accuracy is governed by how we harvest and treat our data
Harvesting
There are two principal methods of harvesting, both of which we use at OTA Insight:
- Using state-of-the-art web crawling technology to collect data directly from external websites; and
- Using an application programming interface – or API – to bridge the gap between booking engines and our platforms.
There are advantages and disadvantages with each. Our main goal with crawling – or “shopping” – data is to get advertised rates as they are displayed to a normal user. We strive to mimic real-life users and emulate requests as they’d be made via a browser.
But we don’t just rely only on crawlers; we also use API integrations for Brand.com platforms and OTAs, which help with volume. These allow us to gather rateshopping data through a unified interface, and they provide data more easily and efficiently.
On the flipside, APIs are often less accurate than crawlers and the data is consumed differently from how end-users see it, meaning discrepancies might creep in. That is why we always combine both methods to provide the most accurate and complete rates in the industry. This brings us on to how we treat our data once we’ve captured it.
Treatment
To ensure data completeness, we employ an industry-leading follow-up system for our whole data retrieval pipeline. We keep track of every hotel from which we planned to collect data and every report we planned to send. Then we perform continuous automatic and hourly manual checks on this to make sure all data is consistent.
Ensuring data accuracy is difficult to prove, and there’s an ethical component; in our case, we endeavour to provide our customers with a great product they can rely on, so we never fake data. Our customer satisfaction levels attest to our success.
Quality control
We operate a number of systems to guarantee the highest levels of quality control. Some are automated; some are manual.
We deploy advanced automated anomaly detection, both for:
- The completeness of the data, so we can check we have data-points for everything; and
- The content itself, to see whether:
- Prices and taxes are correct;
- Other variables, like meal-types, are accurate; and
- We’re detecting the BAR and lowest rates correctly; and
- There are any anomalies.
We also conduct meticulous, manual spot checks on samples of all of our data and data-types. Following a regular schedule, our methods are simple: we compare a random sample of rates on our platform with those on the corresponding native interfaces, be they Brand.com, OTAs or metasearch.In the overwhelming majority of cases, these processes – automatic and manual – reassure us that everything is as it should be: rates are correct and up-to-date, and match other platforms.
After all, we use advanced algorithms that intelligently extract the required information from a webpage, and these work even when OTAs or brands make changes to their websites.
On the rare occasions we spot or are automatically alerted to discrepancies with a data-point or particular source of data, these are immediately escalated to a dedicated engineer, who will assess the cause of the problem – such as data caching, a problem with the API or crawler, or an error in the code – and whether it’s an isolated issue or one that could have a wider impact on a booking engine or OTA.
With significant changes on third-party websites that require human intervention, we’re alerted automatically and will typically change our code before it impacts the customer.
Putting numbers to the argument
To demonstrate why a dual approach to our data-harvesting and treatment is necessary, let’s consider some data analysis we conducted relating to the data feed of one of our chain customers.
Our data science team then evaluated the dataset from 87 of the chain’s properties, comparing and validating all rates across 90+ arrival dates based on Brand.com versus an availability, rates and inventory (ARI) feed, which works in a similar way to an API.
On the surface, most of the ARI feed rate information matched Brand.com, but detailed analysis identified a number of data gaps and mismatches, with discrepancies of 2% or more being flagged up.Issues identified included:
- General inconsistencies in both price and room-type distribution;
- The removal of packaged rates by a manual black list maintained by the chain;
- Deviations in room-type mapping;
- Irregularities in cancellation policies;
- Irregularities in tax configurations; and
- Irregularities in last room availability.
Data accuracy is a revenue manager’s bread and butter; it cannot and should not be undervalued.
To read the white paper from which this article was adapted, please click here.

Are you an industry thought leader with a point of view on hotel technology that you would like to share with our readers? If so, we invite you to review our editorial guidelines and submit your article for publishing consideration.